Other locations:
England – south | England – east | England – west | Wales | Scotland | Northern Ireland | Isle of Man | Channel Islands
The seven tide gauges around the Welsh coast are exposed to three different tidal regimes. The sea level recorded at Llandudno, Holyhead and Barmouth tide gauges are subjected to the tides and weather experienced in the Irish Sea. Fishguard, on the north Pembrokeshire coast, is subject to the tide of the St. George’s Channel. Whereas on the south Wales coast the tide gauges at Milford Haven, Mumbles and Newport all record the sea level which results from the tidal forcing of the Bristol Channel and the weather systems that approach from the Celtic Sea.
The skew surge results are displayed alphabetically by tide gauge location. Click on images to view larger versions.
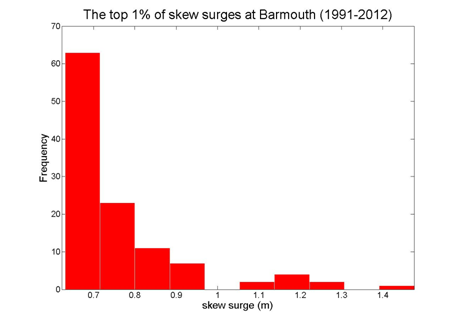
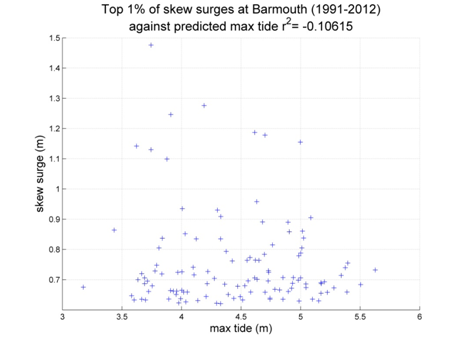
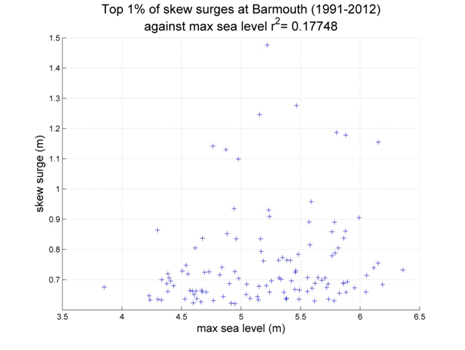
Barmouth
Data from 1991–2012 [data 81% complete]
Top 10 skew surges
Date
Surge (m)
1997/12/24 18:00
1.476
1997/02/19 18:30
1.276
1997/12/25 17:00
1.246
2007/01/18 07:30
1.187
2006/12/03 06:30
1.178
2000/11/25 20:15
1.155
1996/11/06 04:45
1.142
1994/12/08 06:00
1.119
1993/01/17 03:15
1.099
2010/11/11 11:15
0.958
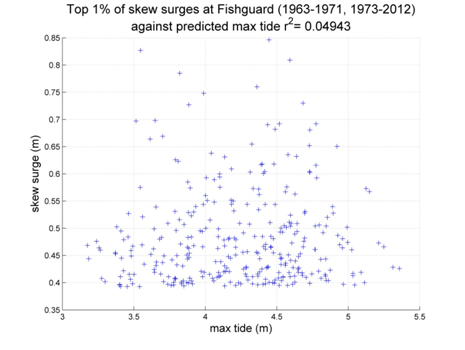
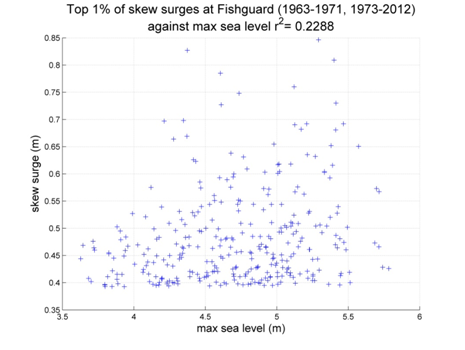
Fishguard
Data from 1963–1971, 1973–2012 [data 94% complete]

Top 10 skew surges
Date
Surge (m)
1989/12/16 22:00
1.015
2006/12/03 05:00
0.846
2002/01/23 13:45
0.827
1998/01/04 11:15
0.809
1976/01/02 20:00
0.790
2000/12/31 22:45
0.785
1996/01/08 21:00
0.760
1997/02/19 17:45
0.748
1994/03/31 22:15
0.730
1963/11/10 15:00
0.727
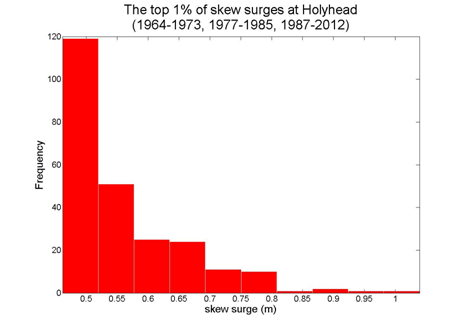
Holyhead
Data from 1964–1973, 1977–1985, 1987–2012 [data 86% complete]


Top 10 skew surges
Date
Surge (m)
1989/12/17 01:00
1.039
1984/01/02 22:00
0.938
1988/02/01 10:00
0.888
2002/02/01 12:45
0.876
2007/01/13 17:00
0.851
1987/03/27 09:00
0.797
2006/11/19 21:30
0.797
1990/01/25 10:00
0.795
2000/12/12 23:30
0.792
2011/02/03 23:00
0.786
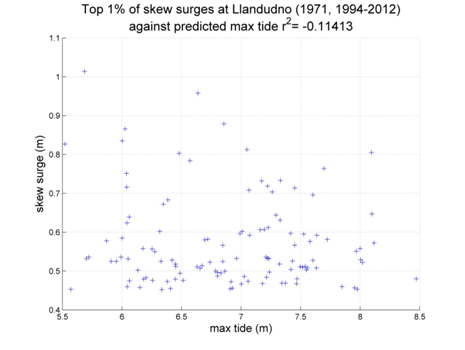
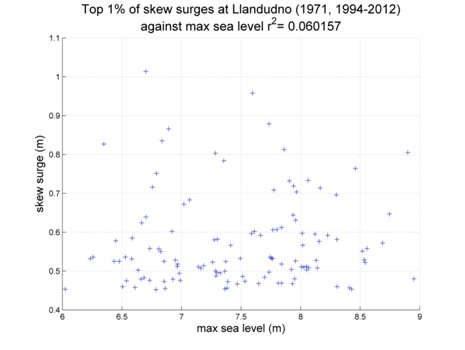
Llandudno
Data from 1971, 1994–2012 [data 87% complete]

Top 10 skew surges
Date
Surge (m)
2007/01/13 18:00
1.014
1997/02/19 21:00
0.958
2005/01/08 08:15
0.879
1997/12/24 19:30
0.866
1996/11/06 07:00
0.835
2008/02/29 16:00
0.827
2006/11/19 22:00
0.813
2002/02/01 13:15
0.805
1999/12/03 08:00
0.803
2011/12/01 02:30
0.784
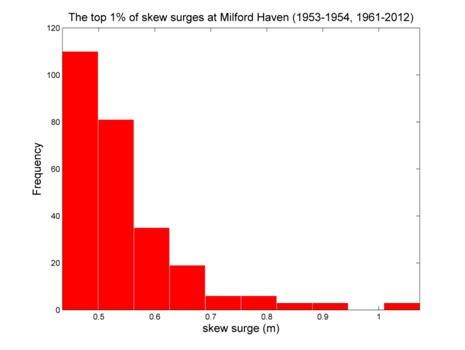
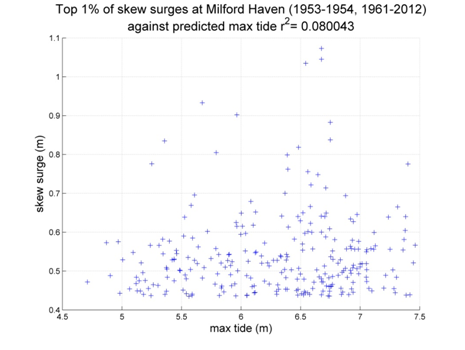
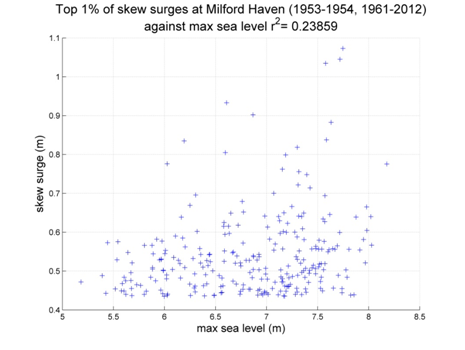
Milford Haven
Data from 1953–1954, 1961–2012 [data 81% complete]
Top 10 skew surges
Date
Surge (m)
1989/12/16 21:00
1.202
1998/01/04 09:45
1.073
1969/01/17 18:00
1.039
2006/12/03 03:45
1.035
1974/01/27 21:00
0.991
1974/01/16 12:00
0.933
1997/02/19 16:45
0.902
1977/03/15 15:00
0.864
1989/12/21 00:00
0.855
1962/01/17 04:00
0.841
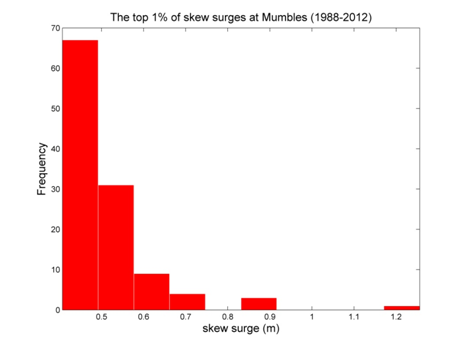
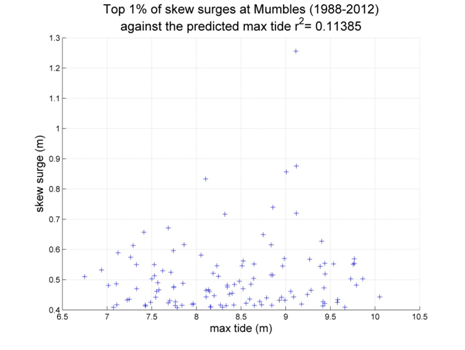
Mumbles
Data from 1988–2012 [data 77% complete]

Top 10 skew surges
Date
Surge (m)
1998/01/04 10:15
1.256
1989/12/16 21:00
1.062
1989/12/16 09:00
0.876
2006/12/03 04:00
0.857
2000/12/08 03:30
0.833
1989/12/21 00:00
0.775
1991/01/01 19:00
0.742
1989/12/17 09:00
0.739
2005/01/08 03:45
0.717
1989/04/11 10:00
0.691
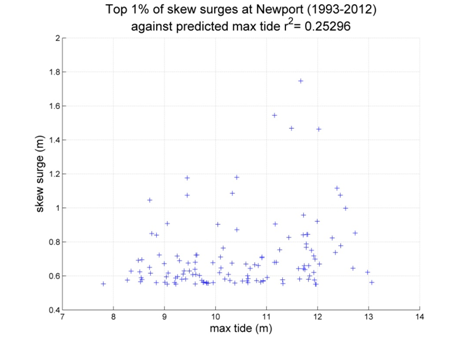
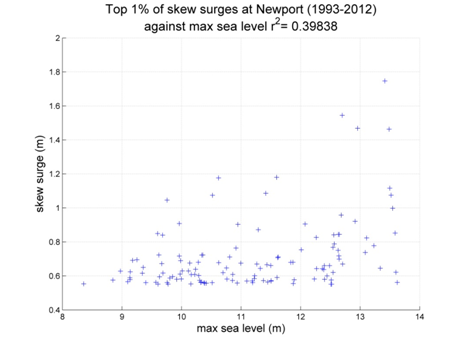
Newport
Data from 1993–2012 [data 90% complete]

Top 10 skew surges
Date
Surge (m)
1997/02/24 20:45
1.747
2006/12/03 05:15
1.545
1998/01/04 11:15
1.468
1995/02/16 19:45
1.463
2005/01/08 04:45
1.180
2004/10/20 23:30
1.176
1999/01/03 07:45
1.116
1997/02/19 18:00
1.086
1996/10/28 20:15
1.075
1997/12/25 15:30
1.074