Other locations:
England – south | England – east | England – west | Wales | Scotland | Northern Ireland | Isle of Man | Channel Islands
Scotland has twelve tide gauges covering its coastline. From Portpatrick on the west coast to the Outer Hebrides and Shetland Islands in the north, they continue to the industrial city of Aberdeen on the east coast and then on to Leith on the southern edge of the Firth of Forth. The western coast of Scotland is exposed to the tides and pressure systems of the North Atlantic while the gauges on the east coast record the level of the North Sea.
The skew surge results are displayed alphabetically by tide gauge location. Click on images to view larger versions.
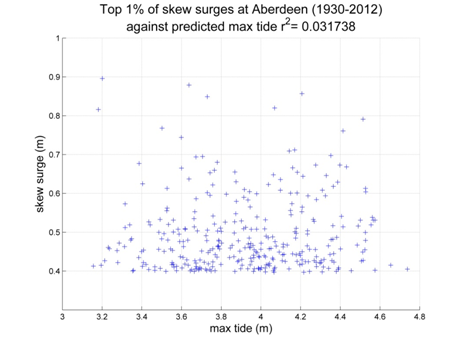
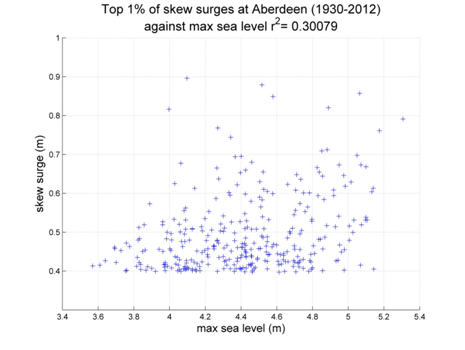
Aberdeen
Data from 1930–2012 [data 80% complete]
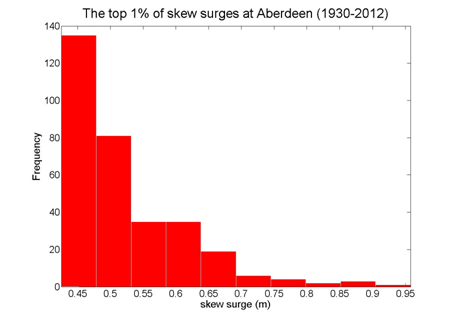
Top 10 skew surges
Date
Surge (m)
1990/02/19 21:00
0.958
1993/01/16 07:15
0.879
1992/01/01 11:00
0.866
2002/02/02 04:15
0.857
2008/10/25 23:00
0.820
2008/03/01 06:45
0.816
1967/02/28 04:00
0.791
2005/01/12 14:30
0.791
2000/01/29 19:45
0.768
1993/01/11 02:45
0.761
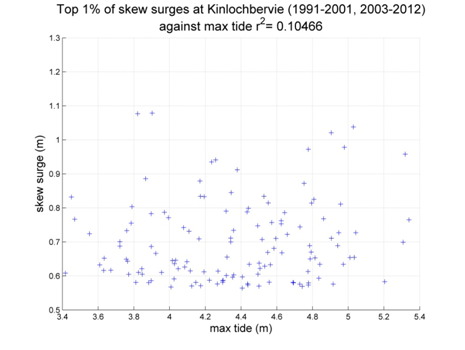
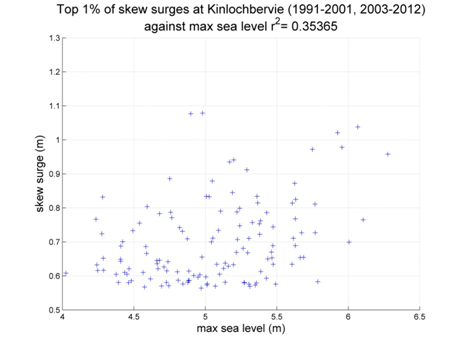
Kinlochbervie
Data from 1991–2001, 2003–2012 [data 89% complete]
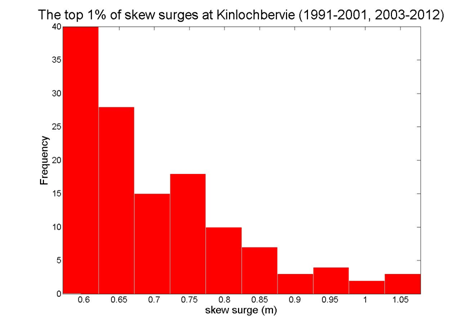
Top 10 skew surges
Date
Surge (m)
2007/01/11 12:30
1.079
1997/03/02 12:15
1.077
1993/01/10 21:00
1.038
1995/01/18 08:15
1.021
2005/01/11 20:15
0.978
2007/03/05 08:00
0.972
2005/01/12 08:30
0.958
1999/01/15 18:30
0.941
2000/01/03 05:30
0.935
1993/01/15 12:45
0.912
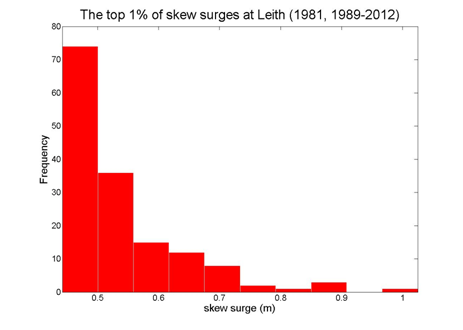
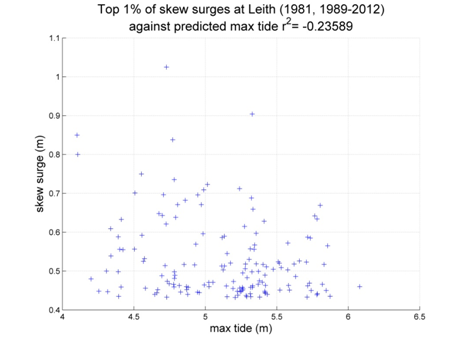
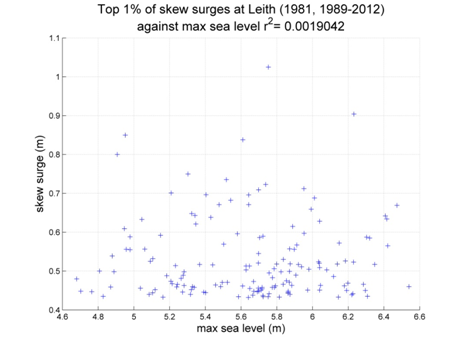
Leith
Data from 1981, 1989–2012 [data 87% complete]
Top 10 skew surges
Date
Surge (m)
1993/01/16 08:15
1.025
1997/02/25 16:15
0.904
1992/01/01 12:00
0.894
1990/02/19 22:00
0.880
2008/03/01 08:00
0.850
2007/01/11 19:45
0.750
2006/01/11 12:15
0.735
2011/12/09 01:30
0.723
2008/10/26 00:30
0.712
1993/12/19 18:30
0.709
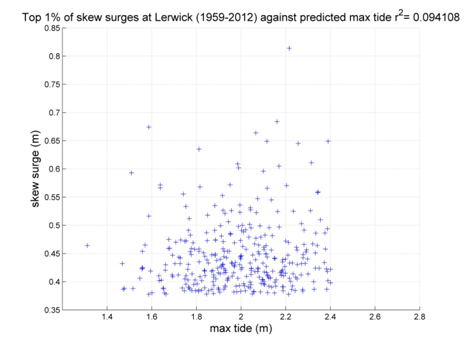
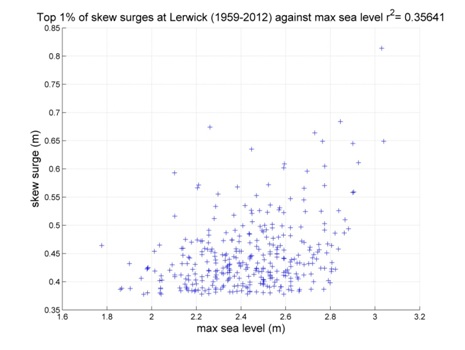
Lerwick
Data from 1959–2012 [data 83% complete]

Top 10 skew surges
Date
Surge (m)
1993/01/11 00:15
0.814
1993/01/12 01:30
0.684
1990/02/20 07:00
0.674
2002/02/02 02:15
0.664
1990/02/27 00:00
0.649
1993/01/11 12:30
0.649
2002/02/02 13:45
0.645
1993/01/17 18:30
0.635
1990/02/27 12:00
0.611
1997/02/25 01:00
0.609
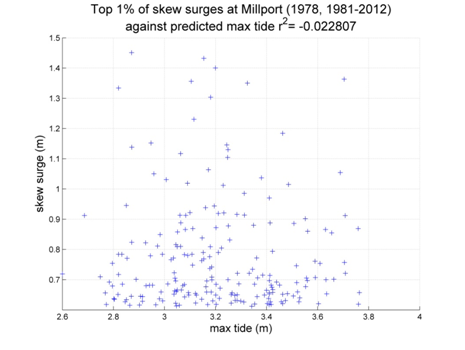
Millport
Data from 1978, 1981–2012 [data 90% complete]


Top 10 skew surges
Date
Surge (m)
2012/01/03 08:15
1.451
1995/01/18 01:15
1.432
1988/02/01 11:00
1.400
1991/01/05 15:00
1.363
1993/01/24 01:30
1.356
1988/02/09 16:00
1.350
1996/11/06 07:15
1.334
2006/12/31 20:15
1.303
1982/03/03 05:00
1.288
2008/01/09 00:30
1.231
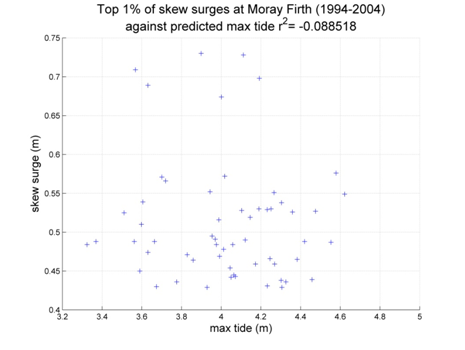
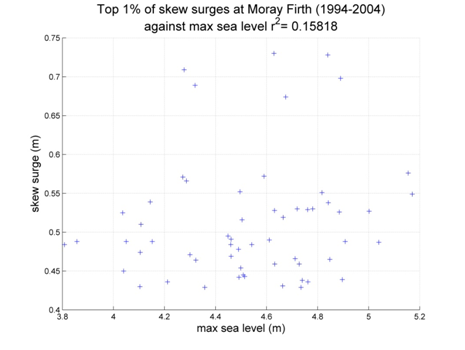
Moray Firth
Data from 1994–2004 [data 75% complete]
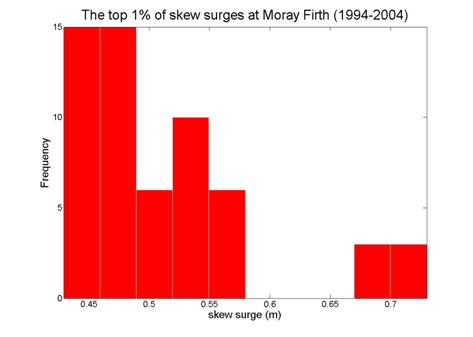
Top 10 skew surges
Date
Surge (m)
1999/01/15 23:00
0.730
1997/02/25 01:45
0.728
2000/01/29 19:15
0.709
1994/04/01 03:00
0.698
1997/02/18 09:15
0.689
2001/10/08 02:30
0.674
1996/02/18 11:45
0.576
1997/02/20 10:15
0.572
1996/11/06 21:00
0.571
2003/01/15 22:15
0.566
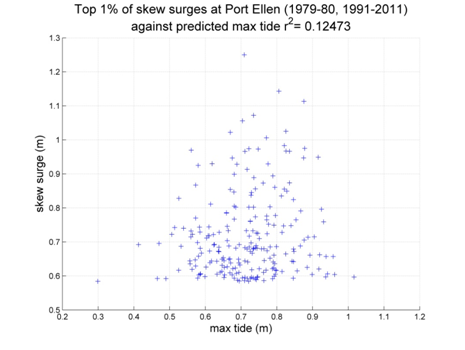
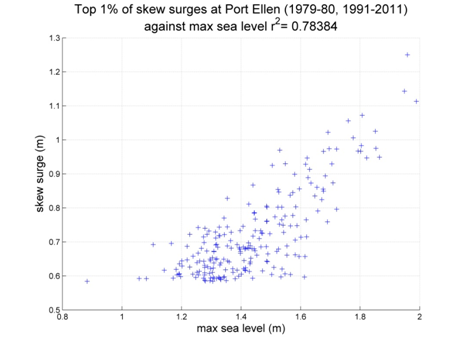
Port Ellen
Data from 1979–1980, 1991–2012 [data 93% complete]
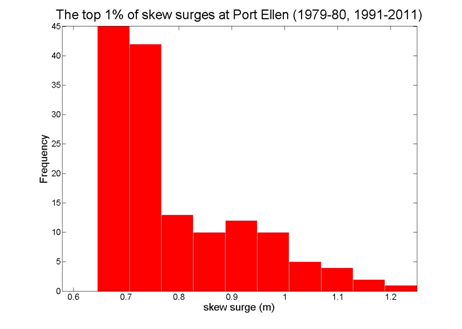
Top 10 skew surges
Date
Surge (m)
1998/12/26 20:00
1.250
1995/01/18 03:00
1.164
2005/01/11 18:45
1.149
1993/01/17 05:45
1.120
2010/11/11 16:45
1.113
2006/12/03 07:15
1.086
1996/11/06 05:30
1.085
2007/01/11 08:15
1.056
2002/03/10 16:15
1.036
2005/11/11 13:45
1.025
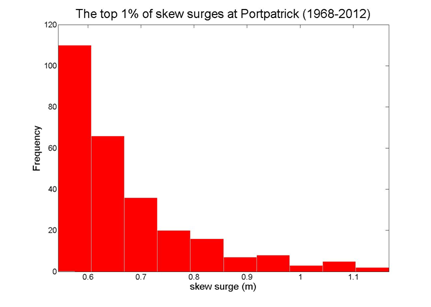
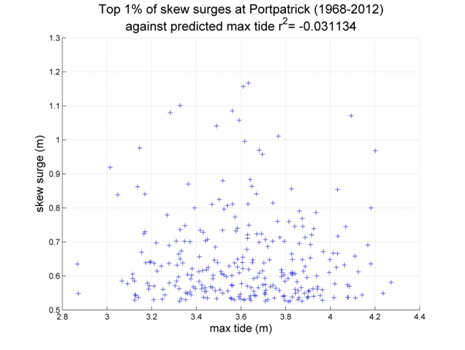
Portpatrick
Data from 1968–2012 [data 87% complete]
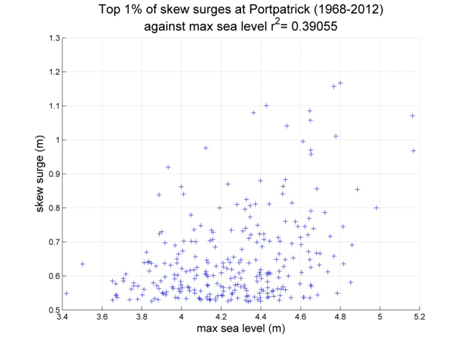
Top 10 skew surges
Date
Surge (m)
1988/02/01 11:00
1.167
1995/01/18 00:00
1.157
1993/01/17 06:15
1.101
1993/01/24 00:45
1.085
1997/12/24 19:30
1.080
1991/01/05 15:00
1.071
1988/02/09 15:00
1.058
2007/03/06 01:00
1.041
2006/12/03 09:30
1.011
2006/12/31 20:45
0.995
Stornoway
Data from 1976, 1978–1981, 1983, 1985, 1986–2012 [data 86% complete]

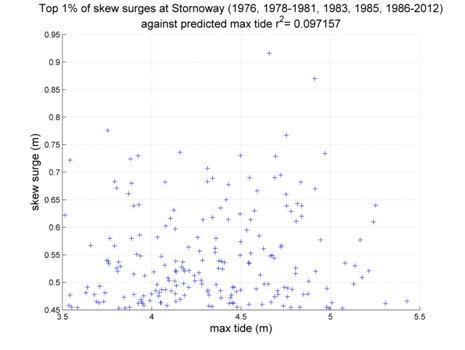
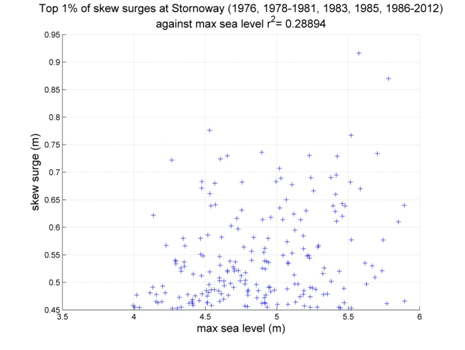
Top 10 skew surges
Date
Surge (m)
1990/02/19 15:00
0.951
2002/02/01 21:45
0.916
1993/01/10 20:15
0.870
1997/03/02 12:15
0.776
2002/01/28 06:30
0.767
1989/12/25 05:00
0.736
2002/02/02 09:45
0.734
2006/11/20 18:45
0.730
2007/01/11 12:15
0.730
1994/03/31 09:45
0.729
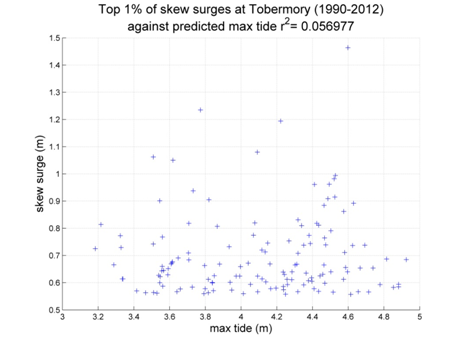
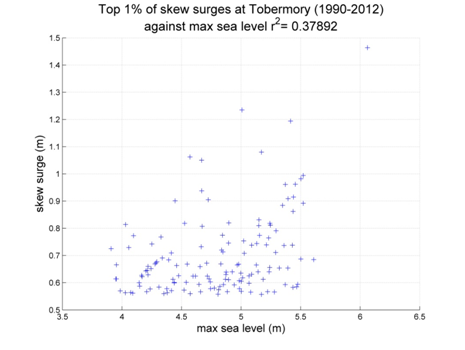
Tobermory
Data from 1990–2012 [data 83% complete]
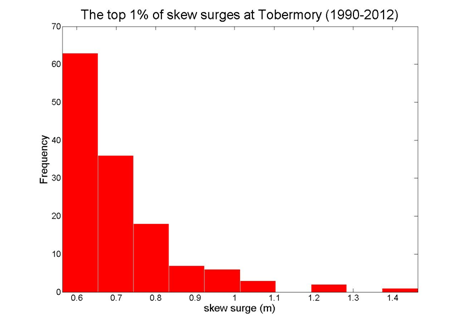
Top 10 skew surges
Date
Surge (m)
2005/01/11 19:00
1.464
2009/01/17 21:45
1.235
1998/11/09 09:15
1.194
2005/11/11 14:30
1.080
1996/11/06 03:15
1.062
2002/03/10 17:15
1.050
1998/01/03 08:30
0.994
1995/01/18 06:45
0.982
1990/02/19 13:00
0.965
1994/03/31 08:15
0.962
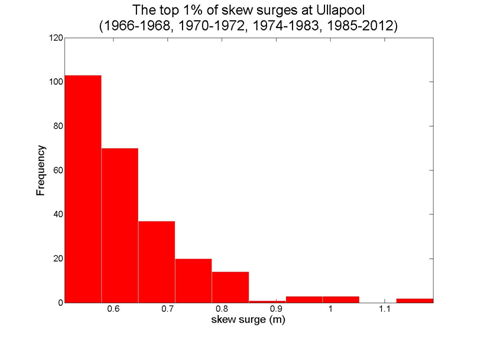
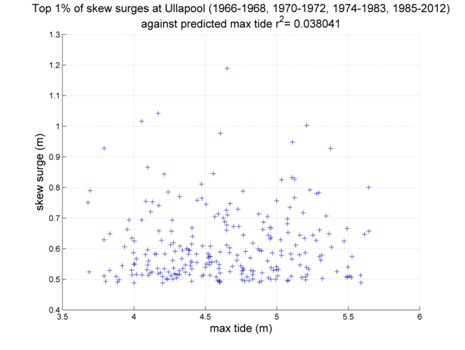
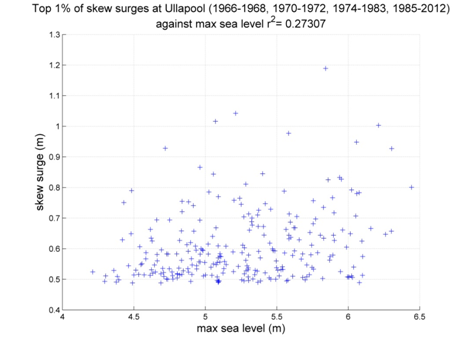
Ullapool
Data from 1966–1968, 1970–1972, 1974–1983, 1985–2012 [data 88% complete]
Top 10 skew surges
Date
Surge (m)
2011/12/08 17:30
1.189
1990/02/19 15:00
1.146
2007/01/11 12:00
1.042
1997/03/02 12:15
1.016
1995/01/18 07:30
1.003
1993/01/15 12:15
0.977
2002/02/01 21:45
0.948
1993/01/10 20:45
0.927
2009/11/25 13:00
0.866
1999/01/15 17:45
0.845
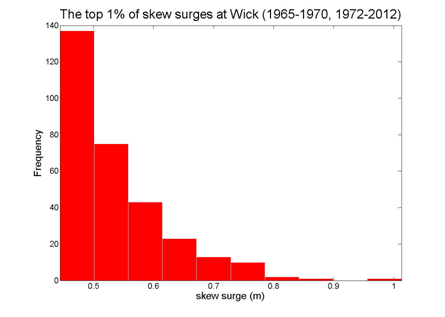
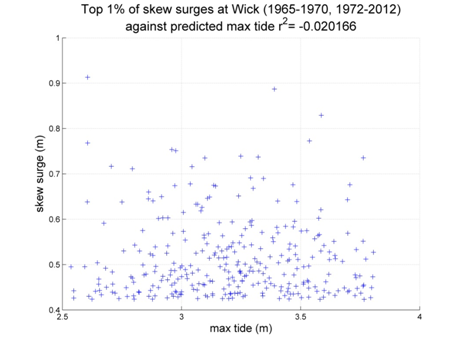
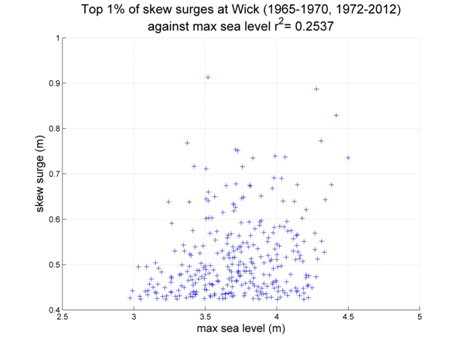
Wick
Data from 1965–1970, 1972–2012 [data 93% complete]
Top 10 skew surges
Date
Surge (m)
1990/02/19 19:00
1.013
2002/02/02 02:15
0.887
1993/01/11 00:45
0.829
1967/10/26 04:00
0.789
2006/12/03 21:45
0.773
1990/02/20 06:00
0.768
2007/01/11 16:00
0.754
1993/01/17 18:30
0.751
1967/02/28 02:00
0.745
1997/02/25 01:00
0.739