Other locations:
England – south | England – east | England – west | Wales | Scotland | Northern Ireland | Isle of Man | Channel Islands
Tide gauges on the east coast of England stretch from North Shields on the north east coast down to Sheerness on the Kent coast. In 1953 there was a large coastal flooding event across the east of England which prompted the installation of the tide gauges around the UK. Communities along the North Sea coast were greatly affected as a result of the surge, which locally exceeded 5.6m above mean sea level, a surge of around 2–3m above high water. The tide gauge at Sheerness is used in the protection of the London metropolitan area from tidal surges. With London’s vast economic importance to the UK and the world, the Sheerness tide gauge is crucial for predicting surge events.
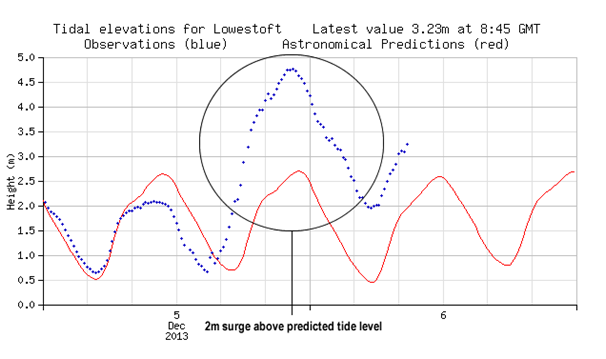
More recently on 5 December 2013 a storm funnelled down the North Sea producing a surge. This surge coincided with high spring tides in the region. The tide gauge at Lowestoft recorded a surge of 2m above the predicted high water (shown left). On this occasion the winds were coming from the north west so the surge was moving along shore. During the 1953 event the winds had more of an onshore orientation, coming from a more north easterly direction. This would have driven more water towards the coast creating a surge of greater magnitude.
The skew surge results are displayed alphabetically by tide gauge location. Click on images to view larger versions.
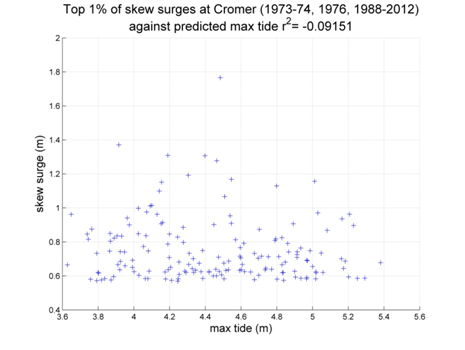
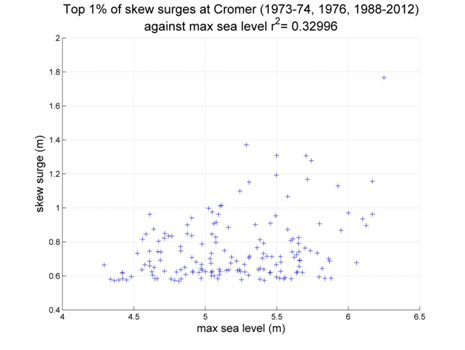
Cromer
Data from 1973–1974, 1976, 1988–2012 [data 90% complete]
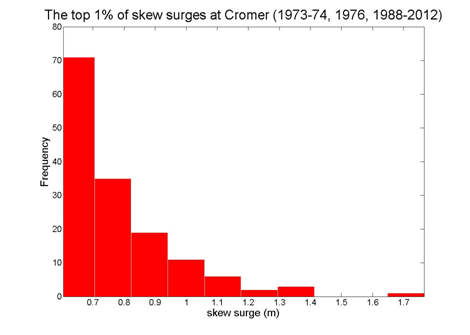
Top 10 skew surges
Date
Surge (m)
1993/02/21 06:15
1.766
2000/01/30 01:45
1.371
2007/01/12 00:00
1.309
2003/12/14 21:30
1.307
1999/02/05 09:15
1.278
2006/11/01 02:15
1.192
1993/01/25 08:00
1.168
1995/01/01 18:00
1.157
1990/12/12 03:00
1.151
1994/01/28 07:00
1.129
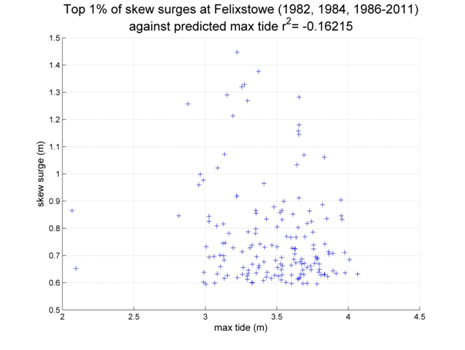
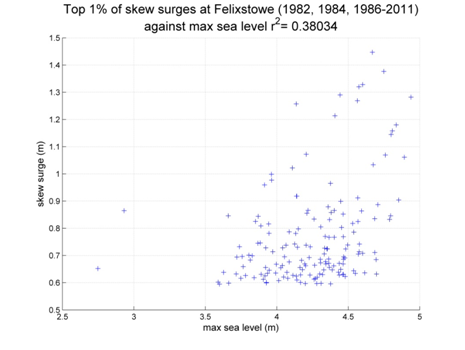
Felixstowe
Data from 1982, 1984, 1986–2011 [data 86% complete]
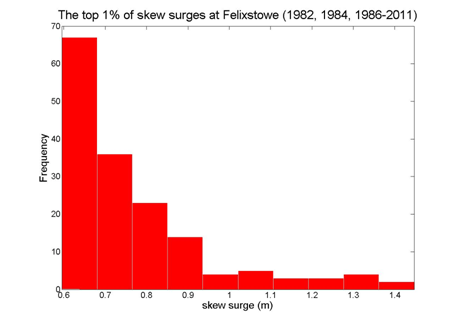
Top 10 skew surges
Date
Surge (m)
1995/01/10 06:15
1.447
1989/02/14 06:00
1.377
1990/12/12 20:00
1.328
1990/12/12 08:00
1.320
2000/01/30 06:00
1.290
1993/02/21 11:30
1.282
2006/10/31 20:15
1.269
2008/03/01 16:00
1.257
2007/01/12 04:45
1.214
2007/11/08 23:45
1.180
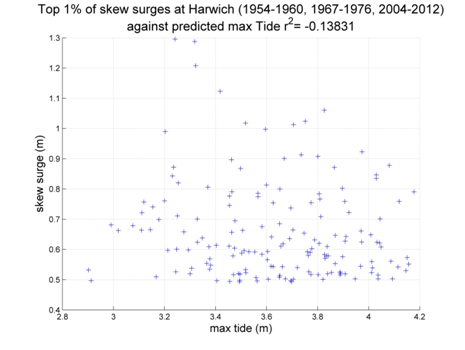
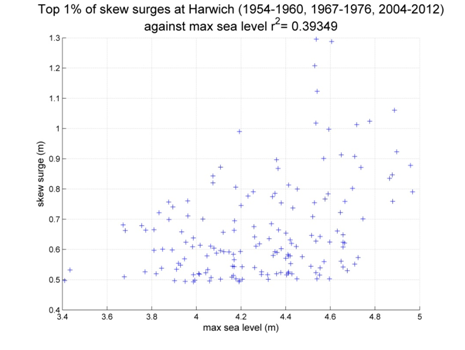
Harwich
Data from 1954–1960, 1967–1976, 2004–2012 [data 87% complete]
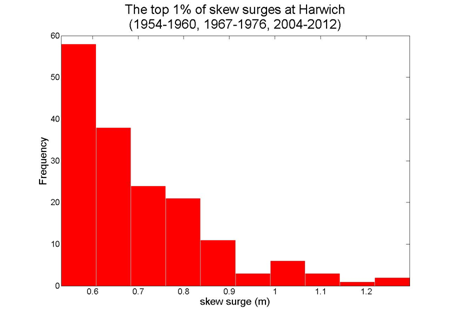
Top 10 skew surges
Date
Surge (m)
2006/11/01 07:45
1.296
2006/10/31 20:30
1.288
2007/01/12 04:30
1.208
1954/12/22 09:00
1.131
2012/01/05 19:45
1.123
2005/12/16 12:00
1.061
1960/01/20 16:00
1.034
2011/12/09 10:45
1.024
1969/02/02 12:00
0.997
1967/03/18 16:00
0.996
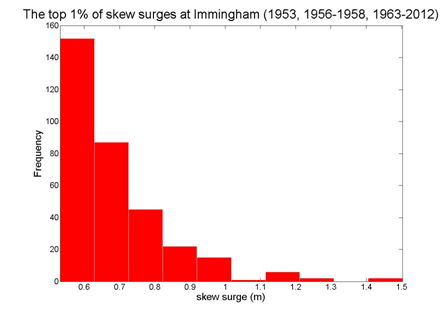
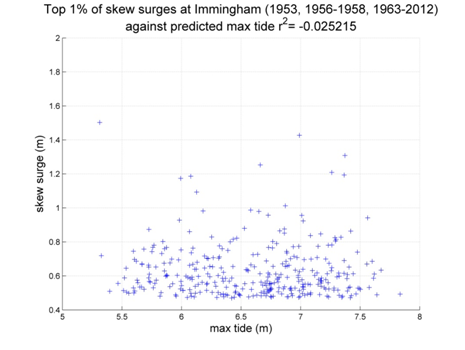
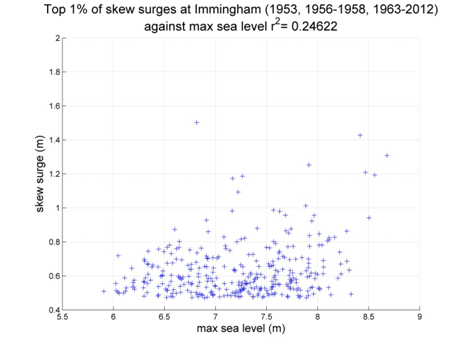
Immingham
Data from 1953, 1956-1958, 1963-2012 [data 92% complete]
Top 10 skew surges
Date
Surge (m)
2008/03/01 11:00
1.503
1953/01/31 19:00
1.427
1983/02/01 20:00
1.308
1993/02/21 06:00
1.253
1976/01/03 19:00
1.209
1969/09/29 07:00
1.193
1983/01/18 09:00
1.192
1990/12/12 02:00
1.186
2007/01/11 23:15
1.174
1981/11/21 02:00
1.173
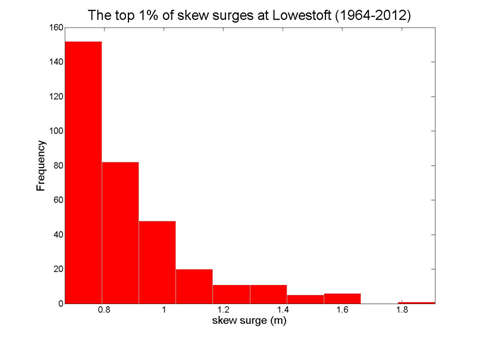
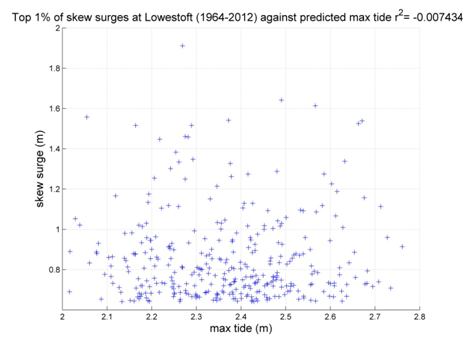
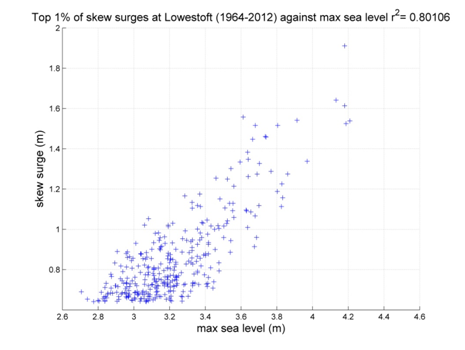
Lowestoft
Data from 1964–2012 [data 97% complete]
Top 10 skew surges
Date
Surge (m)
1993/02/21 09:00
1.911
2007/11/09 08:15
1.642
1976/01/03 21:00
1.614
2008/03/01 13:45
1.562
1990/12/12 19:00
1.547
1994/01/28 09:30
1.541
1969/09/29 10:00
1.538
1983/02/01 23:00
1.525
2000/01/30 04:15
1.516
1989/02/14 06:00
1.516
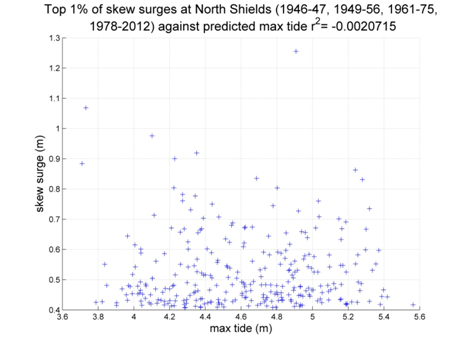
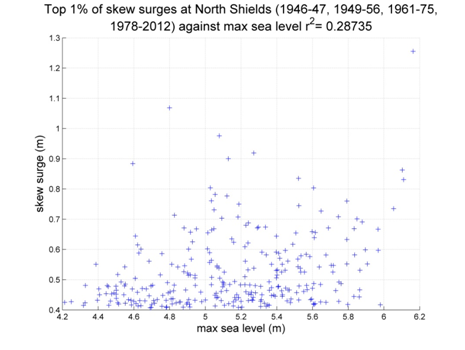
North Shields
Data from 1946–47, 1949–1956, 1961–1975, 1978–2012 [data 83% complete]
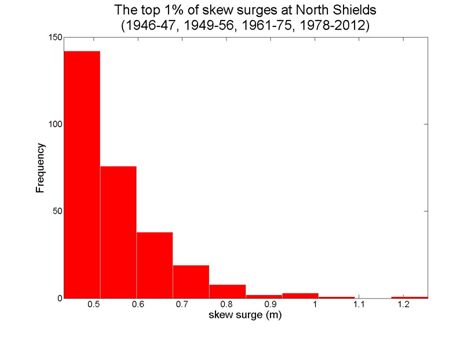
Top 10 skew surges
Date
Surge (m)
1953/01/31 17:00
1.255
2008/03/01 09:15
1.068
2000/01/29 22:30
0.976
1990/02/19 23:00
0.941
1992/01/01 13:00
0.934
2007/01/11 21:00
0.900
1969/09/29 05:00
0.863
1993/02/21 03:15
0.835
2005/01/12 16:45
0.831
2008/12/20 09:30
0.804
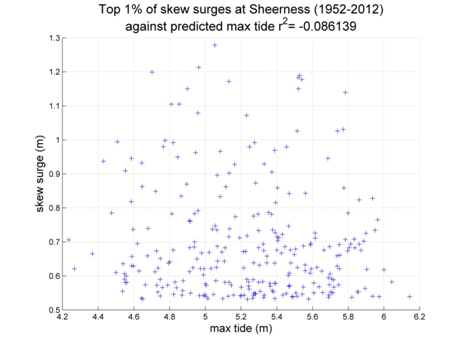
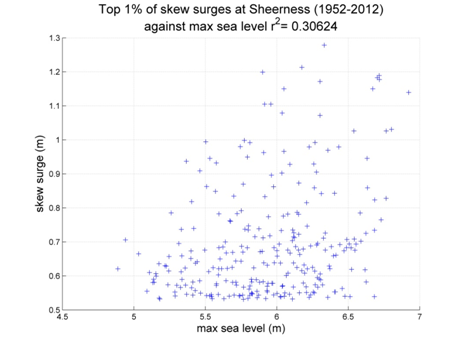
Sheerness
Data from 1952–2012 [data 79% complete]
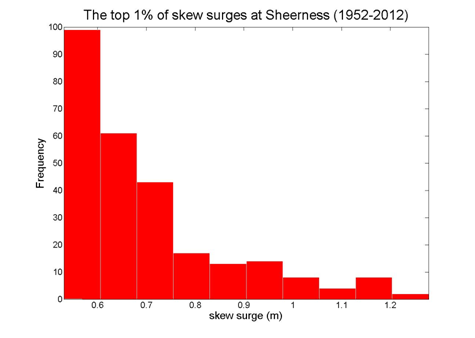
Top 10 skew surges
Date
Surge (m)
1989/02/14 07:00
1.278
1999/12/17 19:15
1.213
2000/01/30 06:30
1.199
2005/12/16 13:00
1.189
1973/11/25 00:00
1.183
1988/12/24 13:00
1.177
1973/12/06 21:00
1.172
2006/10/31 20:00
1.150
1993/01/25 14:00
1.150
1965/12/10 13:00
1.139
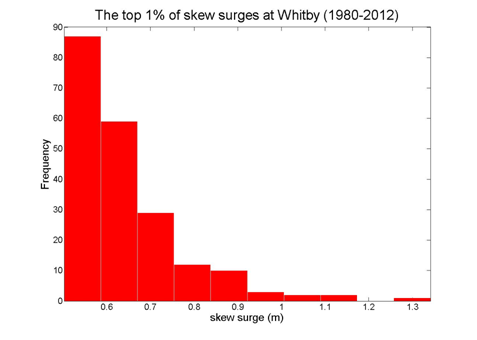
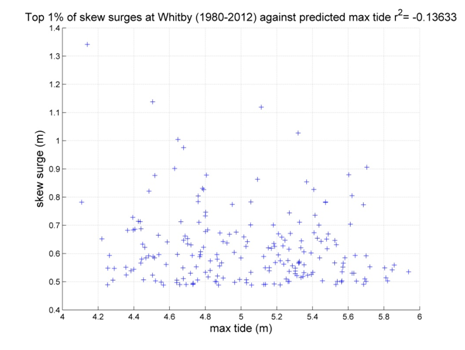
Whitby
Data from 1980–2012 [data 89% complete]
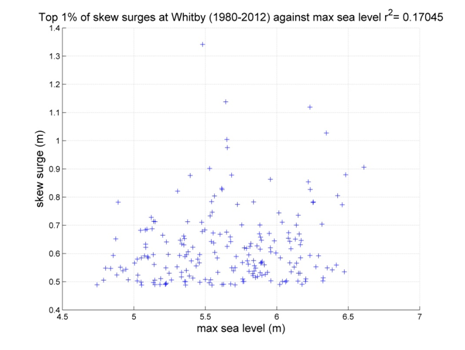
Top 10 skew surges
Date
Surge (m)
2008/03/01 10:00
1.341
2000/01/29 22:45
1.138
1993/02/21 03:45
1.119
1990/12/12 13:00
1.043
2007/11/09 03:15
1.027
2007/01/11 21:15
1.005
1992/01/01 14:00
0.982
2006/10/31 23:15
0.976
1983/02/01 18:00
0.906
2008/12/20 10:00
0.902