Other locations:
England – south | England – east | England – west | Wales | Scotland | Northern Ireland | Isle of Man | Channel Islands
The three tide gauges on the Irish Sea coast of England record the sea level; tides and weather systems that cross the Irish Sea dictate the sea level in this region.
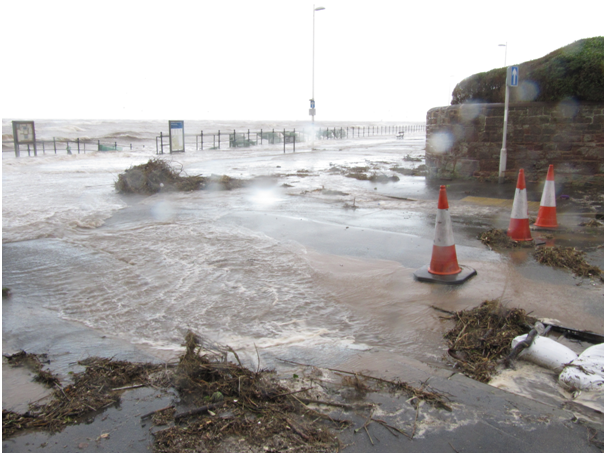
On 5 December 2013 a large storm event across the UK created a surge. This surge peak at the Liverpool tide gauge had an amplitude of 1.25m. The combination of strong northwesterly winds and high spring tides caused flooding in exposed coastal communites like Hoylake (pictured left).
The skew surge results are displayed alphabetically by tide gauge location. Click on images to view larger versions.
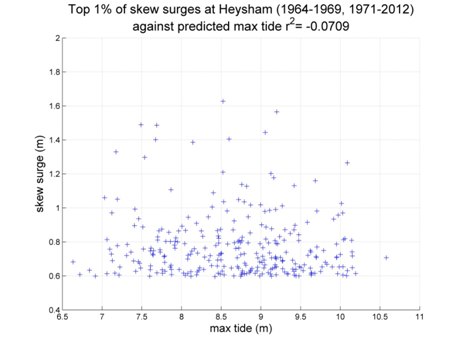
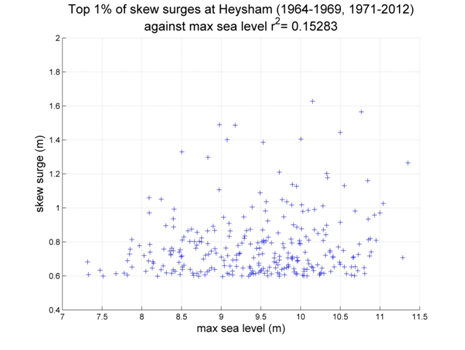
Heysham
Data from 1964–1969, 1971–2012 [data 82% complete]

Top 10 skew surges
Date
Surge (m)
1988/02/09 15:00
1.627
1984/01/13 07:00
1.576
2004/03/19 10:15
1.565
1996/11/06 07:45
1.489
2004/10/21 04:15
1.486
1993/01/24 00:00
1.444
1984/01/02 23:00
1.408
2005/01/08 08:45
1.405
2007/01/11 04:00
1.402
1999/12/03 08:15
1.386
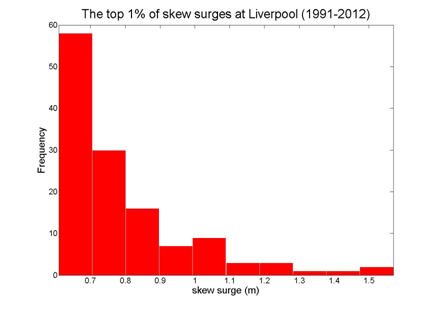
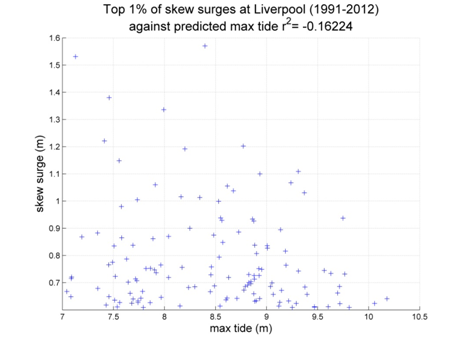
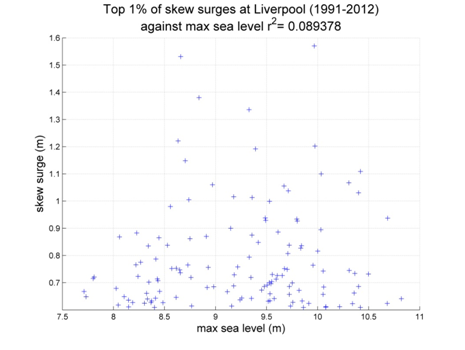
Liverpool
Data from 1991–2012 [data 87% complete]
Top 10 skew surges
Date
Surge (m)
2005/01/08 08:30
1.570
2007/01/13 18:30
1.531
1997/12/24 20:00
1.380
1999/12/03 08:45
1.336
1996/11/06 07:30
1.221
1993/01/24 00:00
1.202
1997/02/19 21:45
1.192
2007/01/11 04:15
1.148
1998/01/03 14:00
1.109
2004/03/19 10:15
1.100
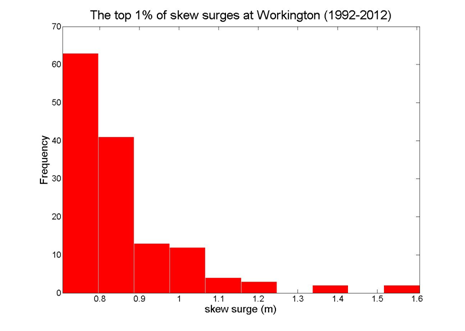
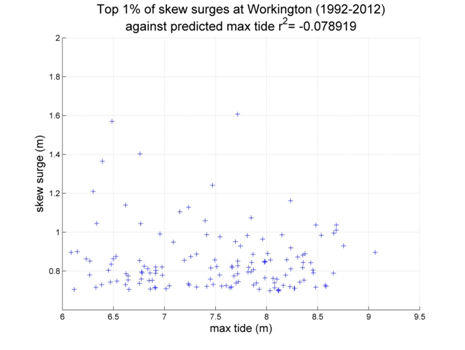
Workington
Data from 1992–2012 [data 95% complete]
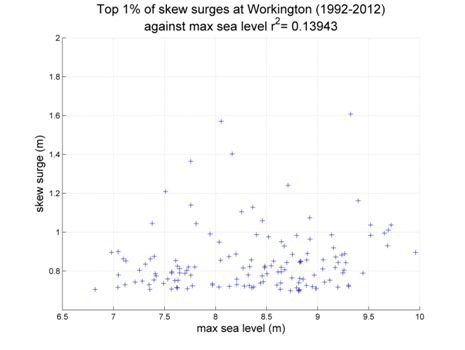
Top 10 skew surges
Date
Surge (m)
1993/01/24 00:15
1.607
1997/12/24 19:45
1.570
1993/01/17 06:30
1.403
1996/11/06 08:00
1.365
1993/01/21 23:00
1.241
2008/01/31 05:15
1.210
1998/01/03 14:30
1.162
2007/01/11 03:45
1.140
1993/12/08 19:00
1.128
1997/02/19 22:00
1.105